Latest from Construction Data
Industry Econ Forecast 2025
Sponsored
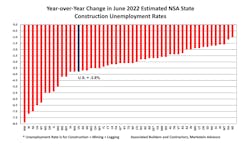
WASHINGTON, DC — The not seasonally adjusted national construction unemployment rate plunged 3.8% in June 2022 from June 2021, down from 7.5% to 3.7%. Meanwhile, all 50 states had lower unemployment rates over the same period, according to a state-by-state analysis of U.S. Bureau of Labor Statistics data released today by Associated Builders and Contractors. Ten states had an estimated construction unemployment rate under 2%; the highest unemployment rate was 6.5% in New Mexico.
In June, national NSA payroll construction employment was 301,000 higher than a year ago and was 46,000 higher than its pre-pandemic peak.
Residential construction employment has fully recovered while nonresidential construction employment remains below its pre-pandemic peak. June SA residential payroll construction employment was 112,000 above its pre-pandemic peak while nonresidential payroll construction employment was 66,000 below its pre-pandemic peak.
The national NSA construction unemployment rate of 3.7% was down 0.3% in June 2022 from its June 2019 reading. Over that same period, 32 states had lower construction unemployment rates and 18 states had higher rates.
“The industry is confronting rising interest rates, slowing national economic growth and the possibility of a recession in the future,” said Bernard Markstein, president and chief economist of Markstein Advisors, who conducted the analysis for ABC. “Further, supply chain disruptions due to the Russia-Ukraine war continue, resulting in more caution in both residential and nonresidential construction. On the plus side, infrastructure construction activity will ramp up over the next several years as funds flow from the federal government from implementation of the 2021 Infrastructure Investment and Jobs Act.”
Recent Month-to-Month Fluctuations
National and state unemployment rates are best evaluated on a year-over-year basis because these industry-specific rates are not seasonally adjusted. However, month-to-month comparisons offer a better understanding of the rapidly changing economic environment on construction employment, though care must be used in drawing conclusions from these numbers.
Since the data series began in 2000, national NSA construction unemployment rates have generally fallen from May to June. June 2022 posted another decline, down 0.1% from May. Twenty-nine states had lower estimated construction unemployment rates than in May, 19 states had higher rates and two (Mississippi and South Carolina) had the same rate.
The Top Five States
The five states with the lowest June 2022 estimated NSA construction unemployment rates were:
1&2. Idaho and Nebraska (tie), 0.9%
3. South Dakota, 1.3%
4. Utah, 1.5%
5. Minnesota, 1.6%
Idaho, Minnesota and Nebraska each posted their lowest June estimated NSA construction unemployment rate on record.
The Bottom Five States
The states with the highest June 2022 estimated NSA construction unemployment rates were:
- Delaware, 5.4%
- Michigan, 5.7%
- New York, 5.8%
- West Virginia, 6.3%
- New Mexico, 6.5%
This was the third month in a row that all states posted construction unemployment rates below 10%. Note that Delaware’s unemployment rate is for construction, mining and logging combined. Michigan posted its lowest June estimated construction unemployment rate since June 2018. New Mexico had the largest year-over-year improvement in its unemployment rate, down 7.9% from June 2021.
Click here to view graphs of overall unemployment rates (Tab 1) and construction unemployment rates (Tab 2) showing the impact of the pandemic, including a graphing tool that creates a chart for multiple states.
To better understand the basis for calculating unemployment rates and what they measure, check out the Background on State Construction Unemployment Rates.
Visit abc.org/economics for the Construction Backlog Indicator and Construction Confidence Index, plus analysis of spending, employment, job openings, GDP and the Producer Price Index.


